Virtual machine migration workflows
Red Hat® OpenShift® Virtualization has recently gone through performance improvements that have further improved large scales behavior, such as the Virt-API pods autoscaling and the migration performance improvement, among other things. The outcomes presented below stand as a testament to the effectiveness of these improvements. The charts below will illustrate both the expected idle VMs migration performance durations and the expected latency overhead induced to migrating VMs under various workload scenarios.
VMs should complete the migration process in a way that should be transparent to the end-user/application. The results below reflect that expected behavior showing minor latency overhead during the migration transactions.
The tests below can be divided into 2 scenarios, one in which we are migrating idle VMs that have no load running, and one in which the VMs are being intensively used.
What will you learn?
- Expected results of OpenShift Virtualization performance under differing workloads and migration scenarios
What you need before starting:
- Configured network and TuneD profiles
- Red Hat Ceph® Storage deployed
- OpenShift deployed
- Virtual machines configured and cloned
Regarding load testing, we have stuck with the same method as in previous tests to maintain consistency. For each test, we have selected a specific number of virtual machines (VMs) to migrate per worker node. This ensures an even distribution of workloads across the cluster, making the results reliable at this large scale. We started with just 1 VM per node in the initial test, resulting in a total of 129 VMs. Then kept increasing up to 8 VMs per node in the final test, giving us a total of 1032 VMs. This approach helps us evaluate system performance across different scenarios.
It's important to highlight that the decision to raise the permissible count of parallel migrations to 25 was a well-considered one, enabled by the specific dimensions of the VMs involved. However, it's crucial to exercise caution when dealing with larger VMs, as their size could potentially impact the ongoing traffic throughput across the network bandwidth. This consideration is paramount to prevent migrations from monopolizing the entire network bandwidth, which could, in turn, result in a slowdown of applications.
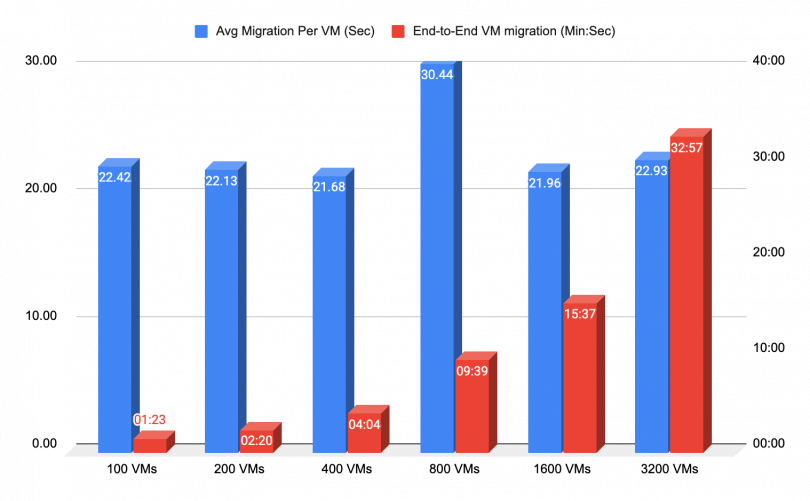
End-to-End VMs Migration
The chart below presents the migration duration of 6000 running VMs, starting at the request time per VM, and ending once the VM is rescheduled and running on a different worker node, with all VMs being idle during the migration process. As shown in the chart, 3200 VMs of the total 6000 VMs were successfully migrated, within 33 minutes, with an average time of 33 seconds per VM.
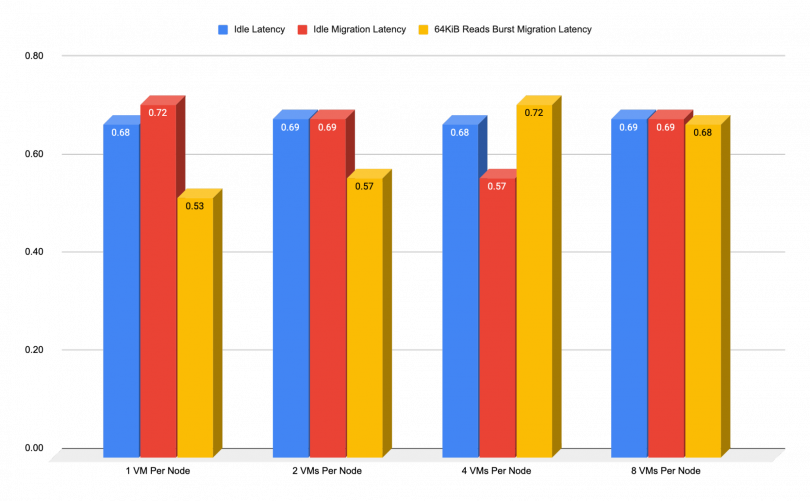
Migration During CPU Intensive Reads
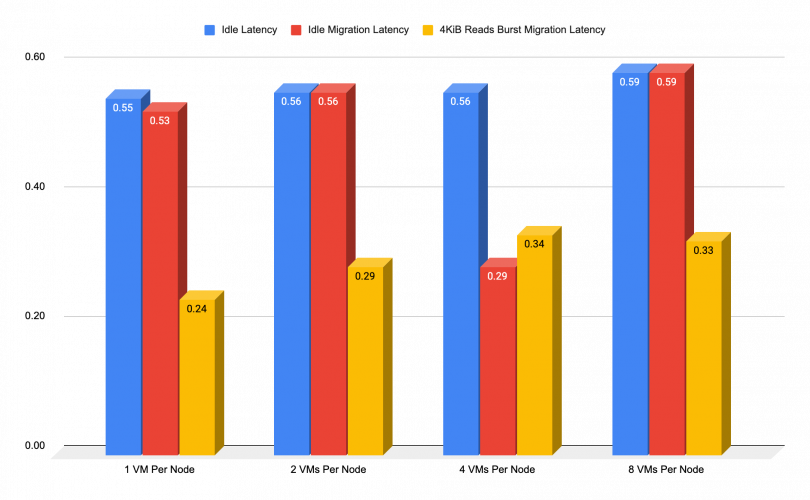
The chart below presents the added latency that could be expected during any type of client/application-induced small IO reads. It illustrates a comparison for VMs while idle, idle migration, and while under load. That kind of workload should not have an impact on the network (to some extent), however, they will increase the VMs CPU consumption.
As we previously mentioned, the Red Hat Ceph Storage reads are the least demanding operation. The chart below illustrates what kind of performance impact, if any, should be expected in that case.
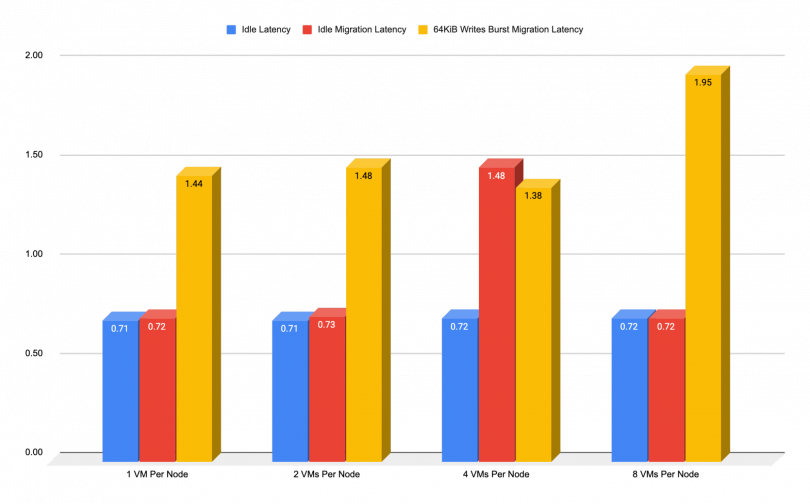
Migration During CPU Intensive Writes
Conversely, the next chart shows the added latency that could be expected during migration when any client/application high IOPS burst. To some extend, small blocks shouldn’t have an impact on the network but they will increase the overall CPU consumption of the VMs.
As we previously mentioned, the Red Hat Ceph Storage writes are the most demanding operation due to the 2 additional replicas of the data ceph creates in order to maintain high availability (HA). The chart below illustrates what kind of performance impact should be expected in this case:
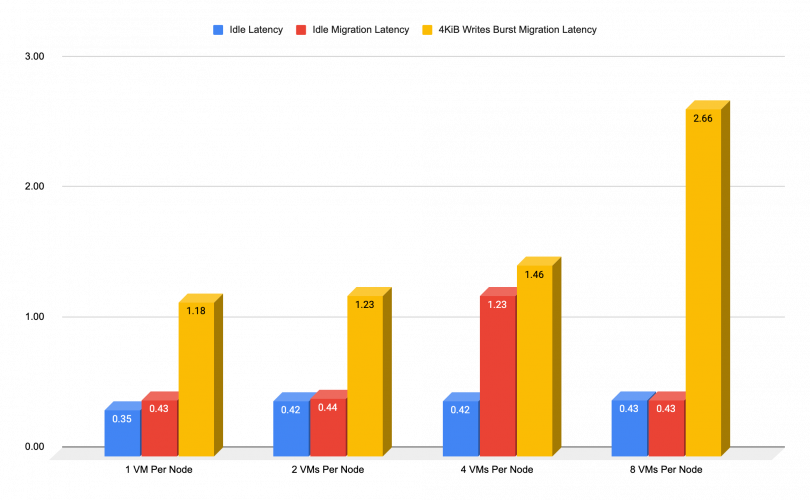
Migration During Network Intensive Reads
If we find ourselves in a situation where we need to migrate during network intensive reads, there is a variation in the expected latency as well. The chart below shows the expected added latency during a migration, while running a heavy read-based throughput on the network. As we previously mentioned, the Red Hat Ceph Storage reads operation has the least demand of an operation, so it is expected to have minimal impact on performance.
Migration During Network Intensive Writes
In further testing, we see what kind of added latency could be expected during a migration while any write-based throughput is being generated on the affected VMs or network The chart below shows the difference in latencies, while while that kind of operation shouldn’t affect the CPU, it can impact the network performance.
As we previously mentioned, the Red Hat Ceph Storage reads are the least demanding operation. The chart below illustrates what kind of performance impact should be expected in this case: