ROSA - Federating Metrics to AWS Prometheus
This content is authored by Red Hat experts, but has not yet been tested on every supported configuration. This guide has been validated on OpenShift 4.20. Operator CRD names, API versions, and console paths may differ on other versions.
Federating Metrics from ROSA is a bit tricky as the cluster metrics require pulling from its /federated endpoint while the user workload metrics require using the prometheus remoteWrite configuration.
This guide will walk you through using the MOBB Helm Chart to deploy the necessary agents to federate the metrics into AWS Prometheus and then use Grafana to visualize those metrics.
As a bonus it will set up a CloudWatch datasource to view any metrics or logs you have in Cloud Watch.
Make sure to use a region where Amazon Prometheus service is supported
Prerequisites
- A ROSA HCP cluster
- aws CLI
- jq
- AWS account permissions to create IAM policies/roles, AMP workspaces, and (optionally) CloudWatch read access
- Cluster administrator access (
cluster-adminor equivalent) to configure cluster monitoring and user workload monitoring
Set up environment
-
Create environment variables
-
Create namespace
Deploy Operators
-
Add the MOBB chart repository to your Helm
-
Update your repositories
-
Use the
mobb/operatorhubchart to deploy the needed operators -
Wait for the Grafana Operator to install
You should see the following after a few minutes
Deploy and configure AWS SigV4 proxy and Grafana Alloy
-
Create a Policy for access to AWS CloudWatch
-
Apply the Policy
-
Create a Trust Policy
-
Create Role for AWS Prometheus and CloudWatch
-
Attach the Policies to the Role
Note: this policy is very permissive, you may want to restrict access for production use cases.
-
Create an AWS Prometheus Workspace
-
Deploy AWS Prometheus Proxy Helm Chart
-
Enable monitoring for user-defined projects if it is not already enabled. The procedure is documented in the Monitoring collection for your OpenShift version; for reference, see Enabling monitoring for user-defined projects
-
Configure remoteWrite for user workloads
Verify Metrics are being collected
-
Access Grafana and check for metrics
-
Browse to the URL provided in the above command and log in with your OpenShift Credentials
-
Enable Admin by hitting sign in and user
adminandpassword -
Browse to
/datasourcesand verify thatcloudwatchandprometheusare presentIf not, you may have hit a race condition that can be fixed by running the following then trying again
-
Browse to
/dashboardsand select the aws-prometheus-proxy -> NodeExporter / Use Method / Cluster dashboard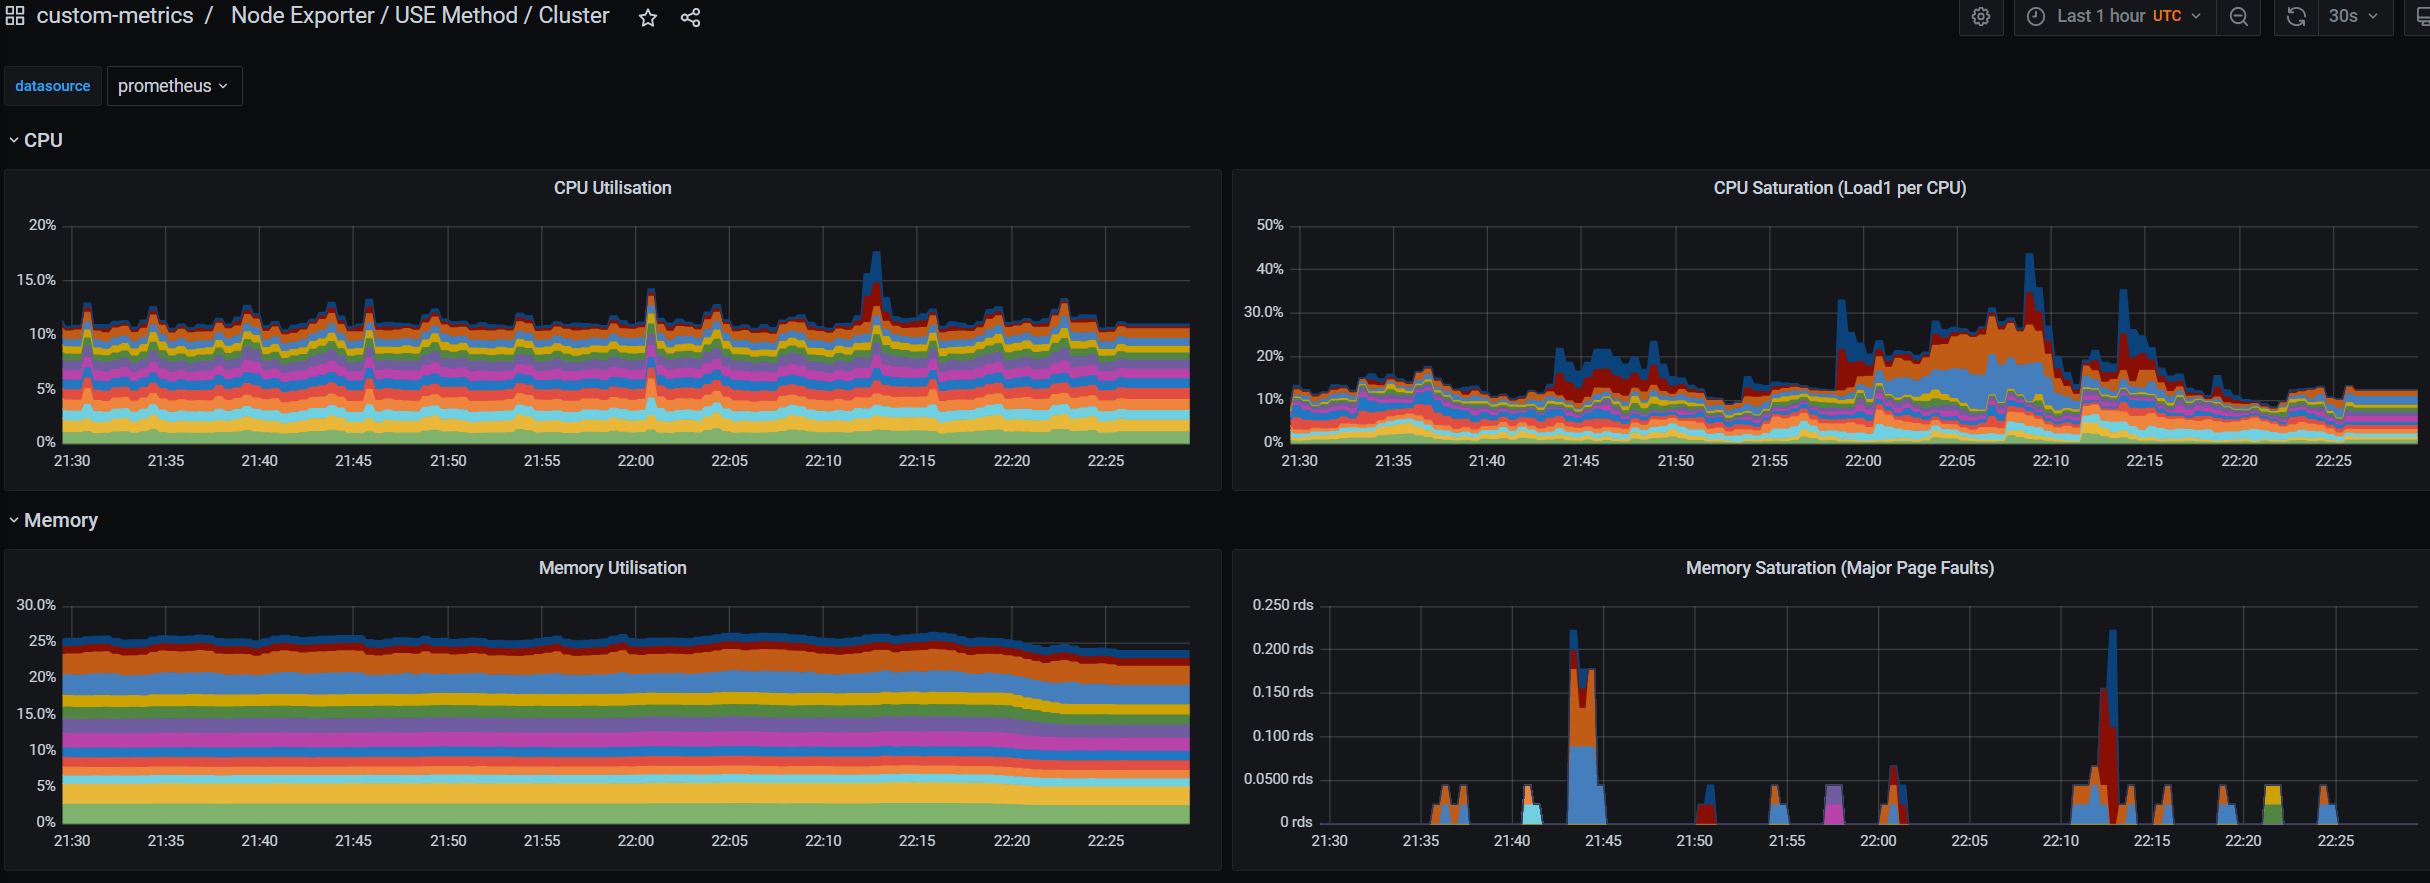
Cleanup
-
Delete the
aws-prometheus-proxyHelm Release -
Delete the
custom-metrics-operatorsHelm Release -
Delete the project namespace
-
Detach AWS Role Policies
-
Delete the custom Cloud Watch Policy
-
Delete the AWS Prometheus Role
-
Delete AWS Prometheus Workspace