Cloud Services Workload Best Practices
This content is authored by Red Hat experts, but has not yet been tested on every supported configuration.
This document describes how to build and operate Kubernetes workloads that are secure, reliable, and operationally sound on Red Hat managed cloud services (ROSA, ARO, and OpenShift Dedicated clusters). It covers the recommended best practices and three complementary enforcement layers: kube-linter for catching misconfigurations before they merge, Popeye for auditing live cluster state on a schedule, and Red Hat Advanced Cluster Management (ACM) for continuously enforcing policies and auto-remediating drift across an entire fleet.
The best practices catalogue and tool coverage data in this guide are based on research conducted for the paulczar/wurst-practices repository, which provides deliberately misconfigured Kubernetes manifests for evaluating cluster sanitizers and policy tools.
Recommended tooling strategy
No single tool covers every enforcement scenario. Use all three layers together, each at the stage where it is most effective.
| Tool | Model | Best used for |
|---|---|---|
| kube-linter | Static analysis (YAML, no cluster needed) | Pre-deploy CI gate on every PR |
| Popeye | Batch scan of live cluster state | Post-deploy audit on a schedule |
| ACM Governance | Continuous policy engine across a fleet | Ongoing enforcement and auto-remediation |
kube-linter catches misconfigurations in manifests before they merge, when feedback is still cheap.
Popeye catches what only a running cluster can reveal: drift, hand-applied changes, right-sizing deltas, and runtime-only problems that never appeared in a branch lint.
ACM Governance is the enterprise control plane: policies are continuously evaluated against every managed cluster and can automatically remediate non-compliant resources rather than just reporting them.
Together they cover intended state in git, observed state in a single cluster, and enforced state across an entire fleet.
Best practices
The severity model below determines how aggressively to gate on each finding.
| Level | Meaning |
|---|---|
| 🔴 Critical | Likely cluster or tenant compromise, major data exposure, or loss of strong workload isolation. Block deploys; require an explicit exception to proceed. |
| 🟠 High | Serious security weakness, frequent or prolonged outages under realistic failures, or clear compliance failure. Block deploys. |
| 🟡 Medium | Reduced resilience, harder operations, noisy-neighbour risk, or slower incident detection. Warn and file a tracking issue; do not block. |
| 🔵 Low | Hygiene with real future consequence: upgrade risk, operational friction, drift, or audit findings. Warn; fix in planned work. |
| ⚪ Style | Consistency and readability conventions only. Report only; never block. |
🗂️ Namespaces, quotas, and limits
- 🟠 Apply a ResourceQuota and LimitRange to every namespace (or via a higher-level policy) so aggregate usage and per-pod defaults are bounded.
- 🟡 Dedicated namespaces per app, team, and environment; never run user workloads in
default.
🔁 Workload reliability
- 🟠 At least three replicas for stateless services that require high availability.
- 🟠 Define a PodDisruptionBudget for every multi-replica workload.
- 🟠
PDB.spec.minAvailablemust be less than the replica count; setting it equal or higher blocks all voluntary disruptions permanently. - 🟠 Configure liveness and readiness probes (and startup probes where needed) with correct ports and thresholds.
- 🟡 Each workload must be covered by at most one PodDisruptionBudget; overlapping selectors silently apply the most restrictive rule.
- 🟡 Never leave a Deployment at zero replicas unless it is intentionally paused.
- 🟡 Use pod anti-affinity or topology spread constraints so replicas do not all land on one node.
- 🟡 Apply node affinity rules to control which node pools or zones workloads are eligible to run on.
- 🟡 Use a rolling update strategy with sensible
maxUnavailable/maxSurgevalues. - 🟡 Always use controllers (Deployment, StatefulSet, DaemonSet, Job) rather than bare Pods.
- 🔵 Use named container ports and consistent Service selectors.
📊 Resource management
- 🟠 Set CPU requests and memory limits (and memory requests) from observed usage.
- 🟡 Right-size requests and limits to match actual consumption; values far below observed usage starve the scheduler, values far above mask leaks and waste capacity.
- 🟡 Size HPA min/max replicas so the sum of all HPAs at maximum scale fits within available cluster CPU and memory.
🔒 Pod security context
- 🔴 Never use privileged containers or enable
hostNetwork,hostPID, orhostIPCunless strictly necessary. - 🔴 Never mount the Docker socket or other sensitive host paths into application pods.
- 🟠 Use non-root users, a read-only root filesystem where possible, and
allowPrivilegeEscalation: falseunless strictly required. - 🟠 Drop dangerous capabilities (e.g.
NET_RAW) and avoid unsafesysctlsor unmasked/procmounts.
🪪 RBAC and service accounts
- 🔴 Enforce least-privilege RBAC: no
cluster-adminbindings to users and no wildcard verb rules. - 🔴 Scope Secret and pod-create access; no blanket
*verbs on sensitive resources. - 🟠 Set
automountServiceAccountToken: falseon pods that do not call the Kubernetes API. - 🟡 Use a dedicated ServiceAccount per workload; do not rely on the
defaultservice account for application pods.
🌐 Network security
- 🟠 Apply NetworkPolicies with a default-deny stance and explicit allow rules for required traffic.
- 🟠 Prefer
ClusterIPfor internal services; justify every NodePort and LoadBalancer; avoid SSH-like ports on workloads.
📦 Image hygiene
- 🟠 Use immutable tags (digest or version pins) in production; never use
latestor floating tags. - 🟠 Restrict images to approved registries; images from arbitrary public registries introduce supply-chain and compliance risk.
- 🟠 Scan images in CI or the registry and block on critical CVEs per policy.
🔑 Secrets and credentials
- 🔴 Never store long-lived cloud IAM keys in Kubernetes Secrets; prefer OIDC / workload identity or short-lived tokens.
- 🟠 Mount secrets as files or use a secret store; avoid plaintext credential-like values in environment variables.
🎛️ OpenShift-specific
- 🔴 Align SCCs / security constraints to workload needs; avoid permissive custom SCCs for normal applications.
- 🔴 Use enterprise identity (OAuth / OIDC) and disable the default
kubeadminaccount after bootstrap. - 🟠 Do not schedule user workloads onto infra or control-plane nodes without strong justification.
💾 Storage
- 🟡 Set reclaim policies and PVC binding to match intent; resolve
ReleasedPVs andPendingPVCs promptly.
🔄 API hygiene and upgrades
- 🟠 Use supported API versions; migrate off deprecated beta APIs before cluster upgrades.
🧹 Cluster hygiene
- 🔵 Remove unused resources (orphaned ConfigMaps, Secrets, Services, RBAC objects, PVCs) regularly.
🚦 Ingress hygiene
- 🟡 Ensure Ingress backend services and ports exist; dangling Ingress rules produce silent 502/503 errors.
- 🔵 Use named ports in Ingress backends rather than port numbers.
⏱️ Batch workloads
- 🟡 Never leave CronJobs accidentally suspended; a suspended CronJob runs no jobs and produces no pod probe failures.
- 🟡 Alert on CronJobs that have never run successfully or that are consistently failing.
kube-linter in CI
kube-linter is a static manifest analyzer that runs without a cluster. It is the right tool for blocking obvious misconfigurations in a pull request gate.
Configuration
Save the following as kube-linter.yaml at the repository root.
It enables all built-in checks and excludes only pure governance annotations (owner label, contact email) that fire on every object regardless of content.
Tune checks.exclude when a check is too noisy for your pipeline, but start with everything enabled so you know what you are silencing.
Running kube-linter locally
GitHub Actions: gate on every pull request
The workflow below runs on every PR that touches Kubernetes manifests or Helm charts. Critical and High findings fail the job; the non-zero exit from kube-linter is the gate.
GitOps (Flux / ArgoCD) patterns
For GitOps repositories where the rendered manifests live in-tree (e.g. Flux HelmRelease with rendered output, or Kustomize overlays), lint the entire output directory:
For Helm-rendered GitOps output committed to git (e.g. rendered by helm template in a pre-commit hook or pipeline), lint the committed YAML directly so you are always scanning what will actually apply.
What kube-linter cannot catch
kube-linter does not connect to a cluster. It cannot see runtime health, actual resource usage, HPA capacity, deprecated APIs in live objects, or CronJob scheduler state. That is where Popeye fills the gap.
Popeye: live cluster auditing on a schedule
Popeye connects to the live Kubernetes API server and surfaces findings that no static analyzer can reach: unhealthy Deployments, selector mismatches, right-sizing deltas, orphaned resources, suspended CronJobs, and more.
Exclusion configuration (spinach)
Create a spinach.yaml file to exclude platform namespaces from cluster-wide scans.
Without it, kube-system, openshift-*, and other control-plane namespaces produce noise that obscures application findings.
Running a one-shot scan
Running Popeye in the cluster
Running Popeye as a Kubernetes CronJob rather than from a developer workstation ensures the audit runs against the live cluster state on a predictable schedule, not only when someone remembers to trigger it. The pattern is:
Popeye’s --push-gtwy-url flag (the “Prom Queen” mode) pushes a Prometheus-format metric snapshot after each scan.
Prometheus scrapes the Pushgateway; Grafana charts scores and findings over time.
Deploying the Popeye observability stack
The following heredocs deploy a complete Popeye + Pushgateway + Prometheus + Grafana stack into a dedicated namespace on OpenShift.
Apply them with oc apply -f - or save to files and apply together.
This is a proof-of-concept deployment, not a production-ready configuration. It is intended to demonstrate the Popeye observability pattern and help you evaluate the tooling quickly. Specific limitations include: emptyDir volumes (data lost on pod restart), a plaintext default Grafana password, no TLS between components, and no persistent storage for Prometheus metrics. Before running this in any environment beyond a throwaway cluster, harden storage, credentials, network policies, and TLS termination to meet your organization’s requirements.
1. Namespace
2. RBAC: ServiceAccount and ClusterRole for Popeye
Popeye needs read access to most resource types across all namespaces.
Grant exactly what it lists; do not use cluster-admin.
3. Spinach ConfigMap (scan exclusions)
4. Pushgateway
Popeye pushes its Prometheus metrics here after each scan. Prometheus scrapes this endpoint.
5. Prometheus
Configured to scrape the Pushgateway so that Popeye metrics are available for Grafana.
6. Grafana
Provisioned with a Prometheus datasource pointing at the in-cluster Prometheus. The admin password is read from a mounted Secret file, not from a plain environment variable.
7. OpenShift Route for Grafana (OpenShift only)
Skip this step on plain Kubernetes; use port-forward instead (see below).
Get the URL after the Route is admitted:
If Grafana shows redirect errors after login, set its public root URL:
8. Popeye CronJob
The CronJob runs every 15 minutes, scans all namespaces (-A), and pushes Prometheus metrics to the Pushgateway.
An init container waits for the Pushgateway to be ready before Popeye starts; a failed push fails the Job, so startup ordering matters.
Set --cluster-name to something meaningful so metrics from multiple clusters can coexist in the same monitoring stack.
--force-exit-zero prevents non-critical Popeye findings from failing the Job (the Job should fail only on scan or push errors, not on linter findings).
Memory: Cluster-wide scans on large or OpenShift clusters often need more than 1 Gi. The default above is 4 Gi; increase limits.memory in the CronJob spec if Popeye pods are OOMKilled.
Operating the stack
Trigger a manual scan
The CronJob runs every 15 minutes. To run a scan immediately without waiting:
Access Grafana
Port-forward (plain Kubernetes or OpenShift):
Retrieve the admin password:
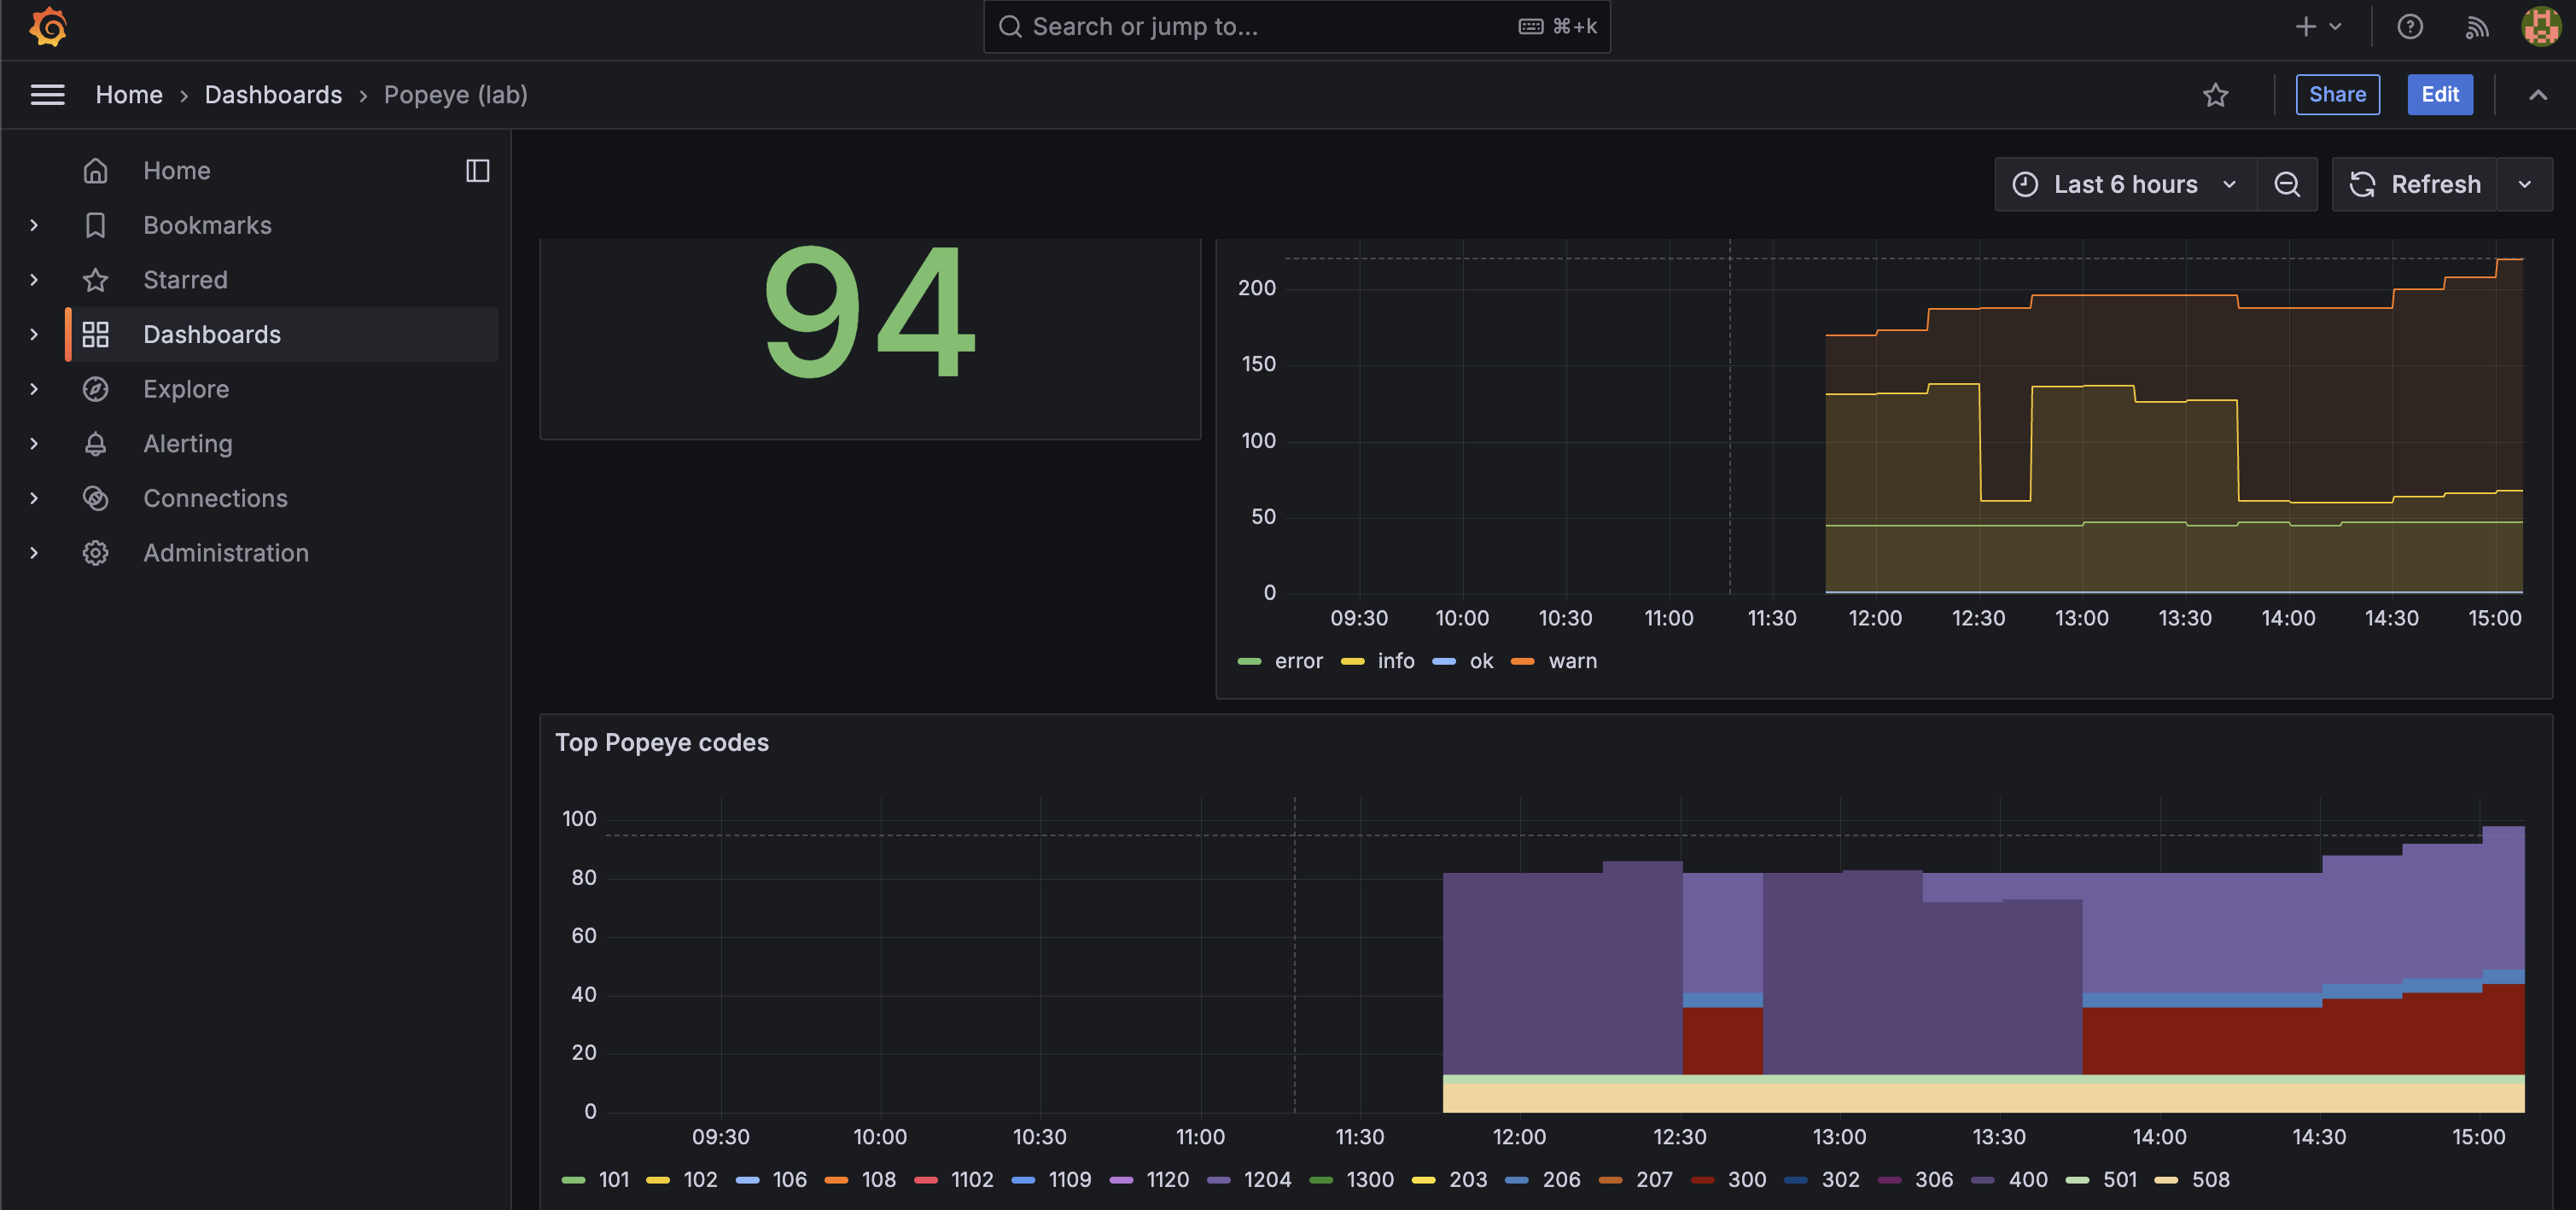
After the first successful Popeye run, navigate to Dashboards -> Popeye (lab). Key metrics to watch:
popeye_cluster_score: overall cluster health score (0-100)popeye_namespace_score: per-namespace health scorepopeye_lint_errors_total: cumulative finding count by severity
The screenshots below show the dashboard before and after applying the deliberately misconfigured manifests from paulczar/wurst-practices , which exercises each of the best practices in this guide.
Before (clean cluster):
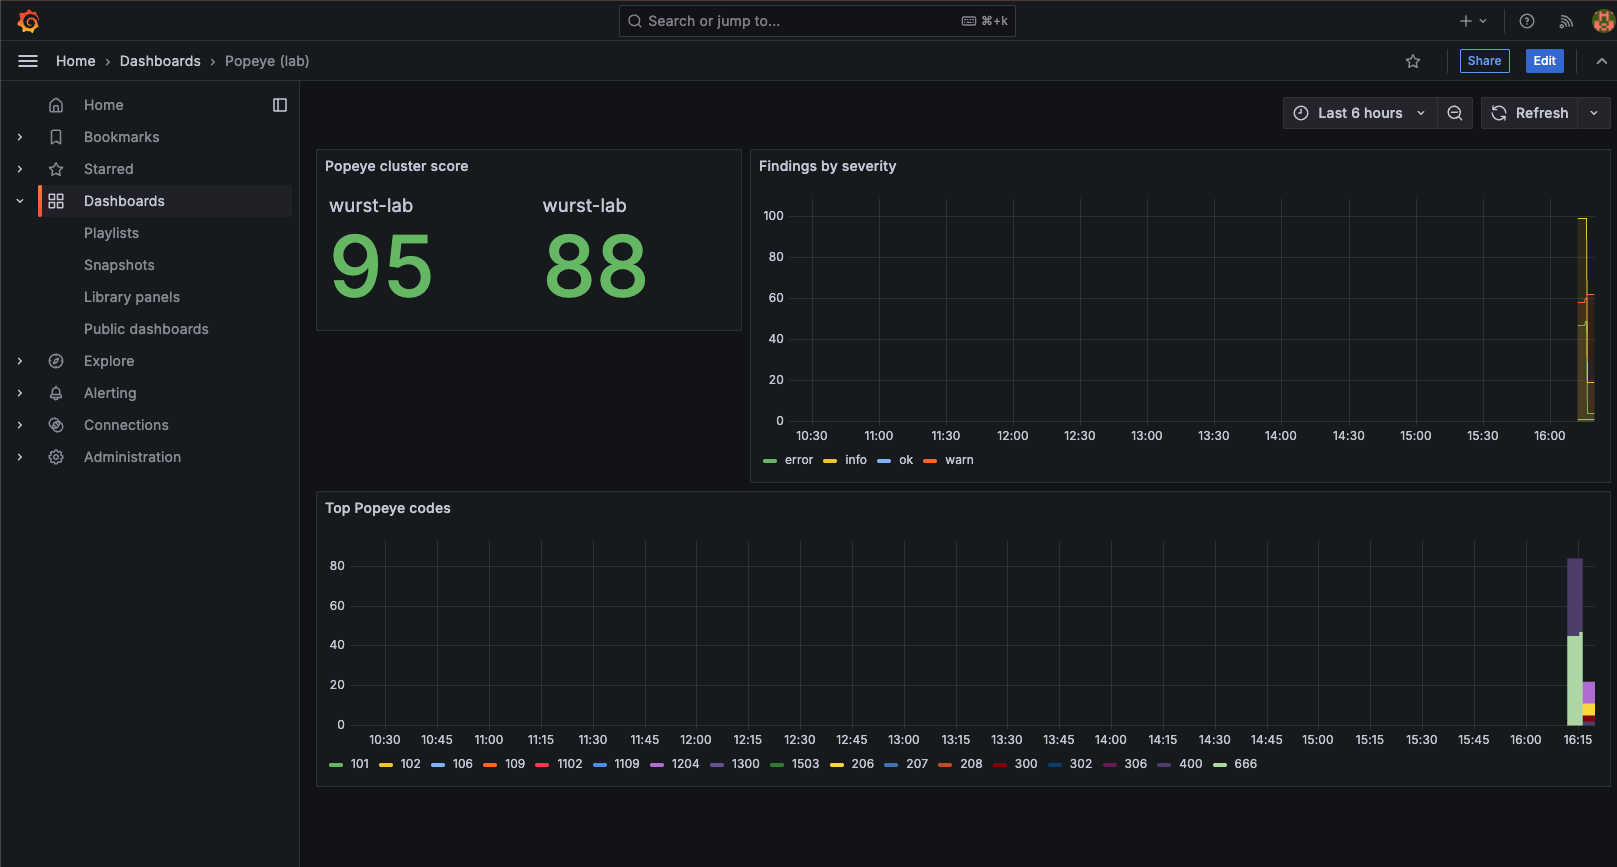
After (bad-practice manifests applied):
Diagnose a failed Popeye Job
Common failure causes:
- Pushgateway not ready: the init container waits up to ~3 minutes; re-apply the stack if the init container did not exist in an older revision.
- DNS / network policy: Popeye must be able to reach
http://pushgateway:9091within the same namespace. - OOMKilled: increase
limits.memoryin the CronJob spec and re-apply.
Tear down the stack
🏢 ACM governance at fleet scale
Red Hat Advanced Cluster Management (ACM) provides a policy engine that evaluates Kubernetes resources continuously across every managed cluster and can automatically remediate non-compliant configurations. Where kube-linter and Popeye provide feedback loops for developers and platform teams, ACM governance is the authoritative control plane that makes the best practices in this guide mandatory and self-healing at enterprise scale.
How ACM policies work
ACM governance uses three core resources working together:
- A
ConfigurationPolicydescribes the desired state of a Kubernetes resource and carries aremediationAction:inform: report non-compliance in the ACM console without changing anything. Use this to baseline existing clusters before enforcing.enforce: automatically create, update, or delete the resource to match the desired state.
- A
Policywraps one or moreConfigurationPolicyobjects and sets top-level metadata (standards, categories, controls) used by the compliance dashboard. - A
Placementselects which managed clusters the policy applies to, using cluster labels, environment tags, orManagedClusterSetmembership. APolicyBindingactivates the policy on the selected clusters.
Mapping severity tiers to remediation actions
Roll out governance in two phases to avoid disrupting existing workloads.
| Severity | Onboarding phase | Target steady state |
|---|---|---|
| 🔴 Critical | inform (audit and baseline) |
enforce (auto-remediate) |
| 🟠 High | inform (audit and baseline) |
enforce (auto-remediate) |
| 🟡 Medium | inform (track in dashboard) |
inform (tracked, not forced) |
| 🔵 Low / Style | inform (optional) |
inform (optional) |
Start all policies in inform mode. Once teams have resolved existing violations, promote Critical and High policies to enforce.
Example: enforcing a LimitRange on every application namespace
The following policy creates a LimitRange in every non-platform namespace across all managed clusters.
Any namespace missing one will have it created automatically when remediationAction is set to enforce.
PolicySets and GitOps delivery
Group related policies into PolicySet objects by severity tier so the ACM compliance dashboard shows a score per tier rather than per individual policy.
Deliver the entire policy library from a GitOps repository using ACM’s Channel / Subscription model or an ArgoCD ApplicationSet targeting the ACM hub:
Storing policies in git means governance changes go through the same pull request review, CI gate (kube-linter), and audit trail as application code. The three layers reinforce each other: kube-linter catches the issue before it merges, Popeye surfaces it if it slips through, and ACM enforces or alerts on it in perpetuity.
Fleet compliance dashboard
The ACM console Governance view provides:
- Per-policy compliance status across all managed clusters
- Per-cluster compliance breakdown by
PolicySet - Violation details linking directly to the non-compliant resource and the diff between actual and desired state
Use this as the authoritative fleet-level health view alongside Popeye’s per-cluster Grafana dashboard for runtime findings.
Choosing between the three tools
| kube-linter | Popeye | ACM Governance | |
|---|---|---|---|
| When | Every PR | On a schedule | Continuously |
| Fixes drift automatically | No | No | Yes (enforce mode) |
| Scope | Single repo or chart | Single cluster | Entire fleet |
| Requires a cluster | No | Yes | Yes (hub + managed) |
| Primary audience | Developers, CI | Platform engineers | Platform / security teams |
CI gate policy by severity
Apply these gates in kube-linter (pre-deploy), when acting on Popeye audit findings, and when setting remediationAction for ACM policies:
| Severity | kube-linter / Popeye | ACM remediationAction |
|---|---|---|
| 🔴🟠 Critical / High | Block the deploy; require an explicit exception to proceed. | enforce (auto-remediate) |
| 🟡 Medium | Warn and file a tracking issue; do not block. | inform (track in dashboard) |
| 🔵 Low | Warn; fix in planned work. | inform (optional) |
| ⚪ Style | Report only; never block or gate. | Not enforced. |
References
- paulczar/wurst-practices : deliberately misconfigured Kubernetes manifests and tool coverage scorecards that this guide is based on
- stackrox/kube-linter : kube-linter source and documentation
- derailed/popeye : Popeye source and Prometheus push documentation
-
ACM Governance documentation
: ACM policy framework,
ConfigurationPolicy, andPolicySetreference - ACM Policy collection : community library of ready-to-use ACM policies covering many of the best practices in this guide