Cloud Experts Documentation

Using the AWS Cloud Watch agent to publish metrics to CloudWatch in ROSA

This content is authored by Red Hat experts, but has not yet been tested on every supported configuration.

This document shows how you can use the AWS CloudWatch Agent to scrape Prometheus endpoints and publish metrics to CloudWatch in a Red Hat OpenShift Service on AWS (ROSA) cluster.

It pulls from the AWS documentation for installing the CloudWatch Agent to Kubernetes and publishes metrics for the Kubernetes API Server and provides a simple dashboard to view the results.

Currently the AWS CloudWatch Agent does not supportexternal link (opens in new tab) pulling all metrics from the Prometheus federated endpoint, but the hope is that when it does we can ship all cluster and user workload metrics to AWS CloudWatch.

Prerequisites

  1. A Red Hat OpenShift Service on AWS (ROSA) cluster
  2. The OpenShift CLI (oc)
  3. The jq command-line interface (CLI)
  4. The Amazon Web Services (AWS) CLI (aws)

Setting up your environment

  1. Ensure you are logged into your cluster with the OpenShift CLI (oc) and your AWS account with the AWS CLI (aws).

  2. Configure the following environment variables:

    export ROSA_CLUSTER_NAME=$(oc get infrastructure cluster -o=jsonpath="{.status.infrastructureName}"  | sed 's/-[a-z0-9]\{5\}$//')
    export REGION=$(rosa describe cluster -c ${ROSA_CLUSTER_NAME} --output json | jq -r .region.id)
    export OIDC_ENDPOINT=$(oc get authentication.config.openshift.io cluster -o json | jq -r .spec.serviceAccountIssuer | sed  's|^https://||')
    export AWS_ACCOUNT_ID=`aws sts get-caller-identity --query Account --output text`
    export AWS_PAGER=""
    export SCRATCH="/tmp/${ROSA_CLUSTER_NAME}/cloudwatch-agent-metrics"
    mkdir -p ${SCRATCH}
    
  3. Ensure all fields output correctly before moving to the next section:

    echo "Cluster: ${ROSA_CLUSTER_NAME}, Region: ${REGION}, OIDC Endpoint: ${OIDC_ENDPOINT}, AWS Account ID: ${AWS_ACCOUNT_ID}"
    

Preparing your AWS account

  1. Create an IAM role trust policy for the CloudWatch Agent service account to use:

    cat <<EOF > ${SCRATCH}/trust-policy.json
    {
       "Version": "2012-10-17",
       "Statement": [{
       "Effect": "Allow",
       "Principal": {
          "Federated": "arn:aws:iam::${AWS_ACCOUNT_ID}:oidc-provider/${OIDC_ENDPOINT}"
       },
       "Action": "sts:AssumeRoleWithWebIdentity",
       "Condition": {
          "StringEquals": {
             "${OIDC_ENDPOINT}:sub": "system:serviceaccount:amazon-cloudwatch:cwagent-prometheus"
          }
       }
       }]
    }
    EOF
    
  2. Create an IAM role for the CloudWatch Agent to assume:

    ROLE_ARN=$(aws iam create-role --role-name "${ROSA_CLUSTER_NAME}-cloudwatch-agent" \
          --assume-role-policy-document file://${SCRATCH}/trust-policy.json \
          --query Role.Arn --output text)
    echo ${ROLE_ARN}
    
  3. Attach the AWS-managed CloudWatchAgentServerPolicy IAM policy to the IAM role:

    aws iam attach-role-policy --role-name "${ROSA_CLUSTER_NAME}-cloudwatch-agent" --policy-arn "arn:aws:iam::aws:policy/CloudWatchAgentServerPolicy"
    

Deploy the AWS CloudWatch Agent

  1. Create a project for the AWS CloudWatch Agent:

    oc new-project amazon-cloudwatch
    
  2. Create a ConfigMap with the Prometheus CloudWatch Agent config:

    cat << EOF | oc apply -f -
    apiVersion: v1
    kind: ConfigMap
    metadata:
      name: prometheus-cwagentconfig
      namespace: amazon-cloudwatch
    data:
      cwagentconfig.json: |
        {
          "agent": {
            "region": "${REGION}",
            "debug": true
          },
          "logs": {
            "metrics_collected": {
              "prometheus": {
                "cluster_name": "${ROSA_CLUSTER_NAME}",
                "log_group_name": "/aws/containerinsights/${ROSA_CLUSTER_NAME}/prometheus",
                "prometheus_config_path": "/etc/prometheusconfig/prometheus.yaml",
                "emf_processor": {
                  "metric_declaration": [
                    {"source_labels": ["job", "resource"],
                      "label_matcher": "^kubernetes-apiservers;(services|daemonsets.apps|deployments.apps|configmaps|endpoints|secrets|serviceaccounts|replicasets.apps)",
                      "dimensions": [["ClusterName","Service","resource"]],
                      "metric_selectors": [
                      "^etcd_object_counts$"
                      ]
                    },
                    {"source_labels": ["job", "name"],
                      "label_matcher": "^kubernetes-apiservers;APIServiceRegistrationController$",
                      "dimensions": [["ClusterName","Service","name"]],
                      "metric_selectors": [
                      "^workqueue_depth$",
                      "^workqueue_adds_total$",
                      "^workqueue_retries_total$"
                      ]
                    },
                    {"source_labels": ["job","code"],
                      "label_matcher": "^kubernetes-apiservers;2[0-9]{2}$",
                      "dimensions": [["ClusterName","Service","code"]],
                      "metric_selectors": [
                      "^apiserver_request_total$"
                      ]
                    },
                    {"source_labels": ["job"],
                      "label_matcher": "^kubernetes-apiservers",
                      "dimensions": [["ClusterName","Service"]],
                      "metric_selectors": [
                      "^apiserver_request_total$"
                      ]
                    }
                  ]
                }
              }
            },
            "force_flush_interval": 5
          }
        }    
    EOF
    
  3. Create a ConfigMap for the Prometheus scrape config:

    cat << EOF | oc apply -f -
    apiVersion: v1
    kind: ConfigMap
    metadata:
      name: prometheus-config
      namespace: amazon-cloudwatch
    data:
      # prometheus config
      prometheus.yaml: |
        global:
          scrape_interval: 1m
          scrape_timeout: 10s
        scrape_configs:
          - job_name: 'kubernetes-apiservers'
            kubernetes_sd_configs:
              - role: endpoints
                namespaces:
                  names:
                    - default
            scheme: https
            tls_config:
              ca_file: /var/run/secrets/kubernetes.io/serviceaccount/ca.crt
              insecure_skip_verify: true
            bearer_token_file: /var/run/secrets/kubernetes.io/serviceaccount/token
            relabel_configs:
            - source_labels: [__meta_kubernetes_service_name, __meta_kubernetes_endpoint_port_name]
              action: keep
              regex: kubernetes;https
            - action: replace
              source_labels:
              - __meta_kubernetes_namespace
              target_label: Namespace
            - action: replace
              source_labels:
              - __meta_kubernetes_service_name
              target_label: Service    
    EOF
    
  4. Create a service account for the CloudWatch Agent to use and annotate it with the IAM role we created earlier:

    cat << EOF | oc apply -f -
    apiVersion: v1
    kind: ServiceAccount
    metadata:
      name: cwagent-prometheus
      namespace: amazon-cloudwatch
      annotations:
        eks.amazonaws.com/role-arn: "${ROLE_ARN}"
    EOF
    
  5. Create a cluster role and role binding for the service account:

    cat << EOF | oc apply -f -
    apiVersion: rbac.authorization.k8s.io/v1
    kind: ClusterRole
    metadata:
      name: cwagent-prometheus-role
    rules:
      - apiGroups: [""]
        resources:
        - nodes
        - nodes/proxy
        - services
        - endpoints
        - pods
        verbs: ["get", "list", "watch"]
      - apiGroups:
        - extensions
        resources:
        - ingresses
        verbs: ["get", "list", "watch"]
      - nonResourceURLs: ["/metrics"]
        verbs: ["get"]
    
    ---
    apiVersion: rbac.authorization.k8s.io/v1
    kind: ClusterRoleBinding
    metadata:
      name: cwagent-prometheus-role-binding
    subjects:
      - kind: ServiceAccount
        name: cwagent-prometheus
        namespace: amazon-cloudwatch
    roleRef:
      kind: ClusterRole
      name: cwagent-prometheus-role
      apiGroup: rbac.authorization.k8s.io
    EOF
    
  6. Allow the CloudWatch Agent to run with the anyuid security context constraint:

    oc -n amazon-cloudwatch adm policy add-scc-to-user anyuid -z cwagent-prometheus
    
  7. Deploy the CloudWatch Agent pod:

    cat << EOF | oc apply -f -
    apiVersion: apps/v1
    kind: Deployment
    metadata:
      name: cwagent-prometheus
      namespace: amazon-cloudwatch
    spec:
      replicas: 1
      selector:
        matchLabels:
          app: cwagent-prometheus
      template:
        metadata:
          labels:
            app: cwagent-prometheus
        spec:
          containers:
            - name: cloudwatch-agent
              image: amazon/cloudwatch-agent:1.300040.0b650
              imagePullPolicy: Always
              resources:
                limits:
                  cpu:  1000m
                  memory: 1000Mi
                requests:
                  cpu: 200m
                  memory: 200Mi
              env:
                - name: CI_VERSION
                  value: "k8s/1.3.23"
                - name: RUN_WITH_IRSA
                  value: "True"
              volumeMounts:
                - name: prometheus-cwagentconfig
                  mountPath: /etc/cwagentconfig
                - name: prometheus-config
                  mountPath: /etc/prometheusconfig
          volumes:
            - name: prometheus-cwagentconfig
              configMap:
                name: prometheus-cwagentconfig
            - name: prometheus-config
              configMap:
                name: prometheus-config
          terminationGracePeriodSeconds: 60
          serviceAccountName: cwagent-prometheus
    EOF
    
  8. Verify the CloudWatch Agent pod is Running:

    oc get pods -n amazon-cloudwatch
    

    Example output

    NAME                                  READY   STATUS    RESTARTS   AGE
    cwagent-prometheus-54cd498c9c-btmjm   1/1     Running   0          60m
    

Create Sample Dashboard in AWS CloudWatch

  1. Download the Sample Dashboard

    wget -O ${SCRATCH}/dashboard.json https://raw.githubusercontent.com/rh-mobb/documentation/main/content/rosa/metrics-to-cloudwatch-agent/dashboard.json
    
  2. Update the Sample Dashboard

    sed -i .bak "s/__CLUSTER_NAME__/${ROSA_CLUSTER_NAME}/g" ${SCRATCH}/dashboard.json
    sed -i .bak "s/__REGION_NAME__/${REGION}/g" ${SCRATCH}/dashboard.json
    
  3. Browse to https://console.aws.amazon.com/cloudwatchexternal link (opens in new tab)

  4. Create a Dashboard, and name it “Kubernetes API Server”

  5. Click Actions and View/edit source

  6. Run the following command and copy the JSON output into the text area:

    cat ${SCRATCH}/dashboard.json
    
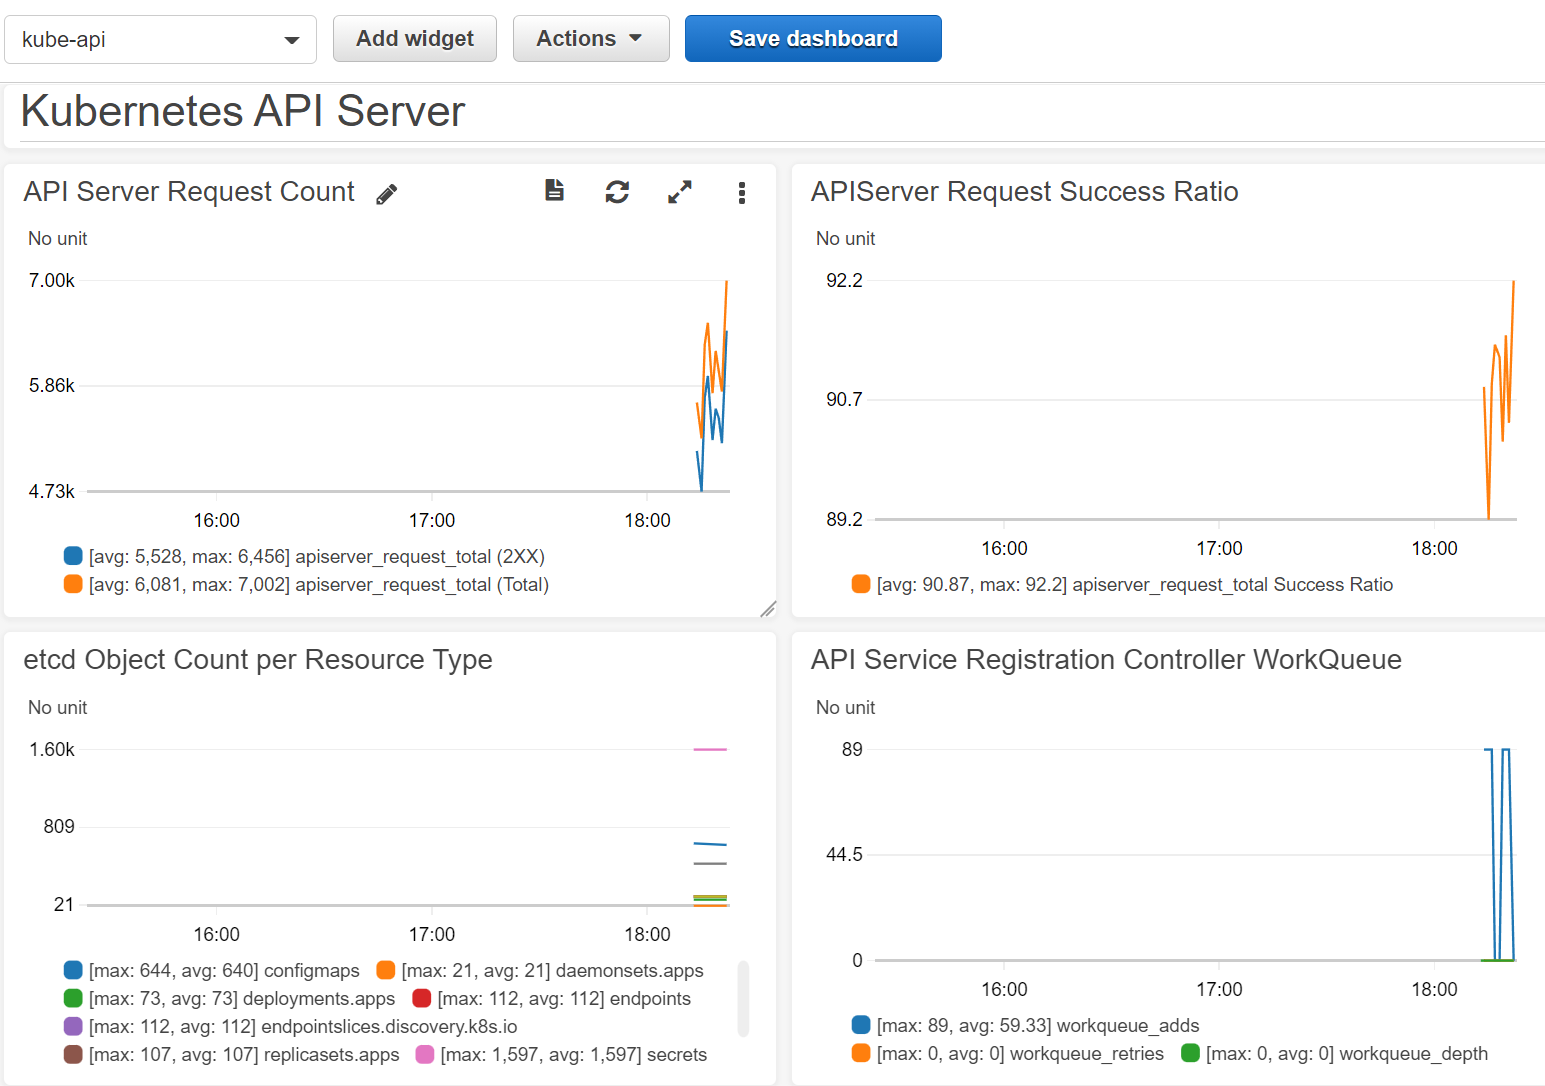
  7. After 5-10 minutes, view the dashboard and see the data flowing into CloudWatch:

    Example AWS Dashboard

Interested in contributing to these docs?

Collaboration drives progress. Help improve our documentation The Red Hat Way.

Red Hat logo LinkedIn YouTube Facebook Twitter

Products

Tools

Try, buy & sell

Communicate

About Red Hat

We’re the world’s leading provider of enterprise open source solutions—including Linux, cloud, container, and Kubernetes. We deliver hardened solutions that make it easier for enterprises to work across platforms and environments, from the core datacenter to the network edge.

Subscribe to our newsletter, Red Hat Shares

Sign up now
© 2023 Red Hat, Inc.